Why it matters
A sentence is read in a line, but an algorithm is not a line. It branches, loops back and sometimes stops early. A flowchart is a diagram that shows the path through an algorithm, so you can see every branch and every loop at once.
That is useful for two reasons. First, drawing forces you to decide what happens in every case. A missing "No" arrow on a decision is obvious on paper, while the same gap in a paragraph of text can hide for days. Second, a flowchart is a common language between people. Teachers, analysts, testers and programmers can all read the same picture, and interviewers still ask you to sketch one on a whiteboard when a problem has many cases.
In this lesson you will learn the five standard symbols, the rules for drawing them, how to trace a flowchart with your finger, and how each shape turns into Python. You will meet eight complete examples, each with a drawing, a trace and a program you can run.
A map for a process
Think of a road map for a very strict traveller. Each place is a box. Each road is an arrow. The traveller starts at one place marked START, and at every place does what the place says, then follows the one road that leaves it. At a junction (a decision) the traveller reads a question on the sign, answers it, and takes the road labelled with the answer.
That is all a flowchart is. The traveller is the computer, the places are steps, and the junctions are questions. The traveller never jumps to a box that has no road to it, and never stops anywhere except at the box marked END.
Board games work the same way. "Roll the dice. If you roll a six, move six and roll again. Otherwise move and pass the dice." You could draw that rule as a flowchart, and the loop (roll again) would show up as an arrow that goes back to an earlier box.
The five symbols
There are many flowchart symbols in the official standards, but five cover nearly everything you will draw in this course.
| Symbol | Shape | Use |
|---|---|---|
| Terminator | Rounded box (oval) | Start and End |
| Process | Rectangle | An action or calculation, such as total = total + i |
| Input/Output | Parallelogram (a slanted rectangle) | Read a value in, or show a result |
| Decision | Diamond | A yes/no question with two exits |
| Flow line | Line with an arrowhead | The direction of travel from one step to the next |
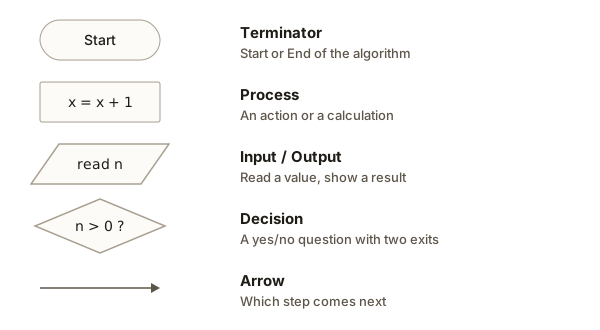 The five flowchart symbols and what each one means
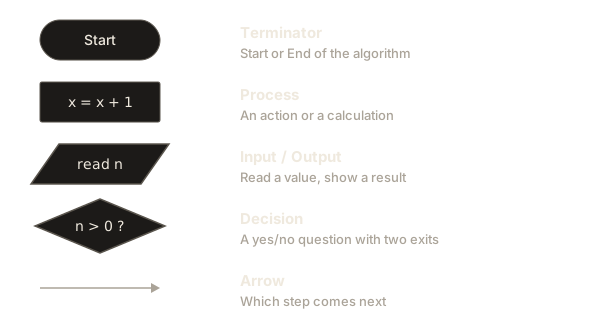
Here are a few details that save trouble.
Terminator. Use exactly one Start. You may have more than one End if the algorithm can finish in several places, but many people prefer a single End that all paths flow into. Either is fine as long as you are consistent.
Process. The rectangle holds a step that does something and moves on. Assigning a value, adding to a total, and swapping two values all belong here. It has one arrow in and one arrow out. If you find yourself wanting two arrows out of a rectangle, you probably need a diamond.
Input/Output. Reading from the keyboard and printing to the screen both use the parallelogram. Many authors write the word read or print inside to make the direction obvious.
Decision. A diamond asks a question that has exactly two possible answers, written as Yes and No (or True and False) on the two exits. The question is something a computer can answer with a comparison: n > 0, i <= 3, answer == "y". A question like "is the number nice?" is not allowed, because the computer cannot answer it.
Flow line. The arrowhead is not decoration. Without it, a reader cannot tell the direction. Draw flow mostly downwards and from left to right when you can, and use extra arrows for loops.
You may also meet two more shapes in larger charts. A predefined process (a rectangle with double side bars) means "run another flowchart that is defined elsewhere", which is the diagram form of calling a function. A connector (a small circle with a letter) means "continue at the matching circle", used when a chart runs off the page.
Rules of drawing
Follow these and your charts will be readable by anyone.
- One
Start. Every path from it must eventually reach anEnd. - A decision has exactly two exits, each labelled.
- A process or input/output box has one arrow in and one arrow out.
- Arrows may join. Two arrows can run into the same box. That is how paths merge after a branch.
- A loop is an arrow that returns to an earlier box. There is no special loop symbol.
- Write steps in short, exact words, close to code:
total = total + i, not "increase the total". - Do not leave boxes with no way out. A dead end means the algorithm does not finish.
In plain text, the same shapes are often drawn like this:
 ( Start )        oval: start or end
 [ x = x + 1 ]    rectangle: process
 /read n/         parallelogram: input
 /print n/        parallelogram: output
 < n > 0 ? >      diamond: decision, with Yes and No exits
How to trace a flowchart
Trace a flowchart the way you would follow a map: put your finger on Start, and move it one box at a time.
- At a process box, do what it says to your variables.
- At an input box, take the next value from the input.
- At an output box, write the value down as output.
- At a decision, evaluate the question with the current variable values, and follow the arrow whose label matches the answer.
- Stop when your finger reaches
End.
Keep a small table beside you with one column per variable. Update it whenever a box changes a variable. This is the trace table, and you will use it constantly.
Example 1: positive, negative or zero
Problem. Read a number n. Print Positive if it is greater than 0, Negative if it is less than 0, and Zero otherwise.
Because there are three possible outcomes and a diamond has only two exits, you chain two decisions. The first asks about positive. If the answer is No, the number is either negative or zero, so the second asks about negative.
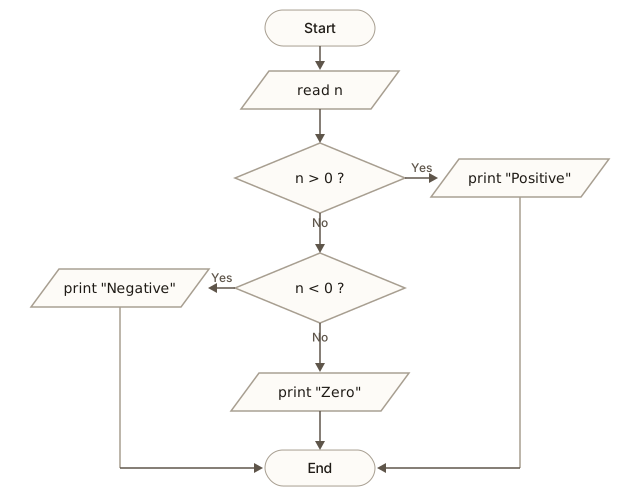 Flowchart that prints Positive, Negative or Zero for a number n
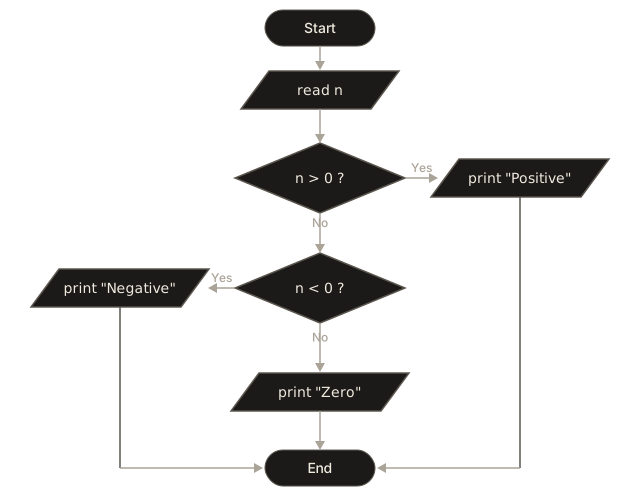
Notice the three arrows that flow into End. Three separate paths merge into one exit. The rule is that every path must end somewhere, not that every path must have its own End.
Trace it for n = -3.
Start
read n            n = -3
n > 0 ?           -3 > 0 is false, take No
n < 0 ?           -3 < 0 is true, take Yes
print "Negative"
End
Now the code. Each diamond becomes an if, the No exit of the first becomes elif (short for "else if"), and the final No becomes else. Type -3 into the Input box, run it, and then try 0 and 8. The call int(input()) reads a line of text and turns it into a whole number.
Output for the input -3:
NegativeCheck the three paths with three inputs, which are also the three tests that cover every arrow of the chart:
| Input | Path through the chart | Output |
|---|---|---|
8 | first diamond Yes | Positive |
-3 | first No, second Yes | Negative |
0 | first No, second No | Zero |
A good rule for testing a flowchart is to choose inputs so that every arrow is used at least once. This chart has one arrow for each of three outcomes, and you need three inputs to walk them all.
Example 2: a loop that counts
Problem. Print the numbers 1, 2, 3.
A loop in a flowchart is an arrow that goes back. The shape is always the same: set up a counter, ask a question, do the work if the answer is Yes, change the counter, and return to the question.
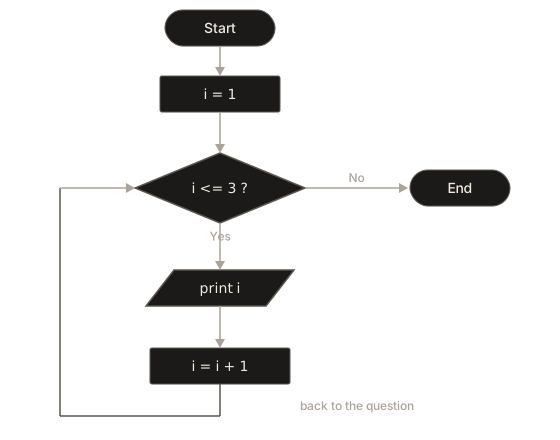
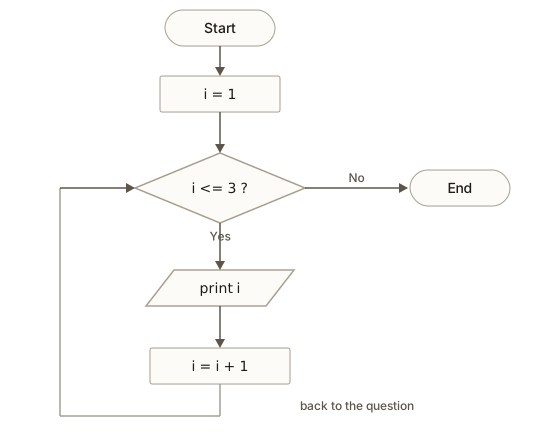 Flowchart of a loop that prints 1, 2, 3: the arrow from i = i + 1 returns to the question
There are three distinct parts to keep in mind, because every loop you ever write has them:
- Initialization:
i = 1runs once, before the question. - Condition:
i <= 3 ?is asked every time round, including the first. - Update:
i = i + 1moves the counter so that the condition will eventually fail.
Trace it. The columns are what i is at the question and what the chart does next.
| Visit | i at the question | i <= 3 | Action |
|---|---|---|---|
| 1 | 1 | Yes | print 1, then i becomes 2 |
| 2 | 2 | Yes | print 2, then i becomes 3 |
| 3 | 3 | Yes | print 3, then i becomes 4 |
| 4 | 4 | No | leave the loop, End |
The question is asked four times and the body runs three times. That difference (one more question than body runs) is worth remembering: the question is always asked one extra time, to discover that it is time to stop.
i = 1
while i <= 3:
    print(i)
    i = i + 1
Output:
1
2
3
The word while is the diamond. As long as the answer is Yes, the indented lines run, and then control goes back up to the question. The two indented lines are the box print i and the box i = i + 1.
Change the condition to i < 3 and run it again. You get only 1 and 2. That one character, <= against <, changes whether the loop runs for i = 3. Programmers call this an off-by-one error, and it is among the most common bugs in all of programming. The fix is always the same: trace the last value by hand and ask whether it should be included.
Example 3: even or odd
Problem. Read a whole number and say whether it is even or odd.
A number is even when dividing by 2 leaves remainder 0. Python's remainder operator is %, so n % 2 is 0 for even numbers and 1 for odd numbers.
 ( Start )
     |
 /read n/
     |
 < n % 2 == 0 ? >--Yes--> /print "Even"/ --+
     | No                                    |
 /print "Odd"/ ---------------------------+
                                           |
                                       ( End )
This is the smallest flowchart with a real decision: two outcomes, one question. In code:
n = int(input())
if n % 2 == 0:
    print("Even")
else:
    print("Odd")
For the input 7 the output is Odd, because 7 % 2 is 1. For the input 10 the output is Even. Negative numbers deserve one test: -3 % 2 is 1 in Python, so -3 is reported as Odd, which is correct. Not every language gives a positive remainder for negative numbers (C++ and Java give -1 for -3 % 2), so a robust check in those languages tests n % 2 != 0 instead of comparing with 1. That small difference between languages is a good reason to test negative inputs deliberately.
Example 4: grade bands, and why order matters
Problem. Read a mark from 0 to 100. Print A for 90 and above, B for 80 to 89, C for 70 to 79, D for 60 to 69 and F below 60.
Five outcomes need four diamonds in a chain. Each question rules one band out and passes the rest on.
 /read marks/
     |
 < marks >= 90 ? >--Yes--> /print "A"/
     | No
 < marks >= 80 ? >--Yes--> /print "B"/
     | No
 < marks >= 70 ? >--Yes--> /print "C"/
     | No
 < marks >= 60 ? >--Yes--> /print "D"/
     | No
 /print "F"/
Every path then runs into End. Notice that no diamond asks "is marks between 80 and 89?" You do not need to. By the time the chart reaches the >= 80 question, the earlier question has already answered No to >= 90, so the mark is below 90, and the only thing left to ask is whether it is at least 80. The order of the diamonds carries information.
Type 85 into the Input box. The first question fails (85 is not at least 90), the second succeeds, and the output is:
BNow see what happens if the questions are in the wrong order. Suppose a learner asks marks >= 60 first:
marks = 95
if marks >= 60:
    print("D")
elif marks >= 70:
    print("C")
The output is D. Every mark from 60 upward answers Yes to the first question, so the later questions can never be reached. The code is valid and runs without any error message, but a mark of 95 is graded D. A flowchart makes this kind of mistake visible: when you look at it you can see that one diamond swallows all the inputs that later diamonds were meant to handle. The rule is to put the most restrictive question first, so each diamond narrows the range.
Test the edges of every band. The boundary values are 90, 89, 80, 79, 70, 69, 60 and 59. If the grade changes at the right place for each pair, the comparisons are right. A mark of exactly 90 should give A, and 89 should give B.
Example 5: a loop that adds
Problem. Read n and print the sum 1 + 2 + ... + n.
This loop has an accumulator, a variable that builds up a result. The accumulator starts at a value that does not change the result (0 for addition) and each pass adds to it.
 ( Start ) -> /read n/ -> [ total = 0 ] -> [ i = 1 ]
                                               |
                                      +------->|
                                      |        v
                                      |   < i <= n ? >--No--> /print total/ -> ( End )
                                      |        | Yes
                                      |   [ total = total + i ]
                                      |        |
                                      +---[ i = i + 1 ]
Trace for n = 5:
| Visit | i | i <= 5 | total after the body |
|---|---|---|---|
| 1 | 1 | Yes | 1 |
| 2 | 2 | Yes | 3 |
| 3 | 3 | Yes | 6 |
| 4 | 4 | Yes | 10 |
| 5 | 5 | Yes | 15 |
| 6 | 6 | No | 15 (leave) |
Type 5 and run. The output is:
15The edge case is n = 0. The first question 1 <= 0 is false right away, so the body never runs, and the output is 0, which is the correct sum of no numbers. This shows why the initial value matters: the accumulator is returned untouched when the loop does not run, so it must already be the right answer for "nothing added".
Example 6: reading until a stop signal
Problem. The user types whole numbers, one per line, and ends by typing 0. Print how many numbers were entered (not counting the 0) and their total.
You do not know in advance how many numbers there will be, so a loop with a counter that goes to a fixed number will not do. Instead the loop repeats until a special sentinel value appears. A sentinel is a value that means "stop" and is not a real piece of data.
The chart has an important shape: the input is read once before the loop and once more at the end of each pass.
 ( Start ) -> [ total = 0 ] -> [ count = 0 ] -> /read x/
                                                    |
                                +------------------>|
                                |                   v
                                |            < x != 0 ? >--No--> /print count, total/ -> ( End )
                                |                   | Yes
                                |           [ total = total + x ]
                                |           [ count = count + 1 ]
                                |                   |
                                +------------- /read x/
Why read twice? The question x != 0 needs a value of x the first time it is asked, so you read before the loop. After processing a number, you must fetch the next one before asking again, so you read again at the bottom. If you forget the second read, x never changes, and the loop never ends (or processes the first number forever).
Put these four lines in the Input box, one number per line: 4, 10, -2, 0. The output is:
count: 3
total: 12
Trace:
| Read | x != 0 | total | count |
|---|---|---|---|
| 4 | Yes | 4 | 1 |
| 10 | Yes | 14 | 2 |
| -2 | Yes | 12 | 3 |
| 0 | No, leave | 12 | 3 |
The 0 is read and tested but never added, because the loop body is skipped when the question fails. If the very first number is 0, the output is count: 0 and total: 0, which is a sensible answer for an empty list.
Example 7: the biggest item of a list, and where it sits
Problem. Given a list of numbers, print the largest and the position (index) where it first appears. Positions start at 0, so the first item is at position 0.
This combines the loop of Example 5 with the "best so far" decision from Lesson 1. A list is an ordered row of values written in square brackets, and numbers[i] is the item at position i.
 ( Start ) -> [ best = numbers[0] ] -> [ best_pos = 0 ] -> [ i = 1 ]
                                                              |
                                         +------------------->|
                                         |                    v
                                         |      < i < length ? >--No--> /print best, best_pos/ -> ( End )
                                         |                    | Yes
                                         |      < numbers[i] > best ? >--No--+
                                         |                    | Yes          |
                                         |      [ best = numbers[i] ]        |
                                         |      [ best_pos = i ]             |
                                         |                    |              |
                                         |                    +<-------------+
                                         |                    |
                                         +-------------- [ i = i + 1 ]
Two arrows meet before i = i + 1: the Yes path (after updating) and the No path (nothing to update). That is a merge, and it is why a rectangle can have more than one arrow entering it.
Output:
largest: 8 at position 1Trace the list [3, 8, 2, 8, 5]:
i | numbers[i] | bigger than best? | best | best_pos |
|---|---|---|---|---|
| start | 3 | 0 | ||
| 1 | 8 | Yes | 8 | 1 |
| 2 | 2 | No | 8 | 1 |
| 3 | 8 | No (8 is not greater than 8) | 8 | 1 |
| 4 | 5 | No | 8 | 1 |
The second 8 at position 3 does not replace the first, because the test is strictly greater. That is why the position reported is the first one. If you wanted the last position of the largest value you would change > to >=. Deciding which one the problem wants is part of reading the specification carefully, and a flowchart makes the choice visible as one symbol in one diamond.
len(numbers) is the number of items in the list, 5 here, so the loop runs for i from 1 to 4 and never touches position 5, which does not exist. Going one position too far is another off-by-one error, and in Python it produces this message:
IndexError: list index out of rangeExample 8: a loop with two exits
Problem. A card machine allows 3 attempts at a PIN. If an attempt is right, say so. If all 3 are wrong, lock the card.
This loop can stop for two different reasons: success or running out of tries. In a flowchart that is a single diamond whose condition combines both, or two diamonds. Here is one way to see it as a chart:
 ( Start ) -> [ tries = 0 ] -> [ granted = False ]
                                    |
                +------------------>|
                |                   v
                |   < tries < 3 and not granted ? >--No--> < granted ? >--Yes--> /print "Access granted"/
                |                   | Yes                                 | No
                |             /read attempt/                       /print "Card locked"/
                |             [ tries = tries + 1 ]
                |                   |
                |   < attempt == correct ? >--Yes--> [ granted = True ]--+
                |                   | No                                  |
                |           /print "Wrong PIN"/                           |
                |                   |                                     |
                +-------------------+-------------------------------------+
A flag such as granted is a variable that holds True or False and records whether something has happened. The loop condition reads the flag. After the loop ends, the code reads the flag again to see which of the two exits was taken.
Type 1111, 2222, 4321 on three lines. The output is:
Wrong PIN
Wrong PIN
Access granted after 3 tries
Now type 1111, 2222 and 3333. All three are wrong, tries reaches 3, the condition tries < 3 becomes false, and the loop ends. The output is:
Wrong PIN
Wrong PIN
Wrong PIN
Card locked
Test the edge: a right PIN on the first try gives Access granted after 1 tries (the wording is imperfect for 1, and a real program would fix the grammar, but the logic is right). The two key inputs are "right on the last allowed try" and "wrong three times". Those two cover the boundary where the loop stops.
Example 9: leap years, a decision with a combined rule
Problem. A year is a leap year if it is divisible by 4, except that years divisible by 100 are not leap years, unless they are also divisible by 400. So 2024 is a leap year, 1900 is not, and 2000 is.
Rules with exceptions are what flowcharts are best at. Instead of squeezing the rule into one long condition, ask one question at a time:
 ( Start ) -> /read year/
                  |
          < year % 400 == 0 ? >--Yes--> /print "Leap year"/ -> ( End )
                  | No
          < year % 100 == 0 ? >--Yes--> /print "Not a leap year"/ -> ( End )
                  | No
          < year % 4 == 0 ? >--Yes--> /print "Leap year"/ -> ( End )
                  | No
          /print "Not a leap year"/ -> ( End )
Read the order. Years divisible by 400 are settled first (leap). Of those that remain, years divisible by 100 are not leap. Of those that remain, years divisible by 4 are leap. Everything else is not.
Four inputs cover all four exits: 2000 (leap, by 400), 1900 (not, by 100), 2024 (leap, by 4) and 2023 (not, by the final else). Type 1900 and the output is:
Not a leap yearCompare the one-line version: year % 4 == 0 and (year % 100 != 0 or year % 400 == 0). It means the same thing, but it is much harder to read and check, and a mistake in the brackets changes the answer silently. When a rule has exceptions inside exceptions, the chain of questions is safer.
From flowchart to code
Once you have drawn a few flowcharts, the translation to code becomes mechanical. This table summarises what each shape or pattern becomes.
| In the flowchart | In Python |
|---|---|
Rectangle x = x + 1 | the line x = x + 1 |
Parallelogram read n | n = int(input()) |
Parallelogram print n | print(n) |
| Diamond with two exits, no loop | if ...: and else: |
| Chain of diamonds on the No side | elif ...: |
| Diamond with an arrow looping back | while ...: |
| Loop that counts from a start to an end | for i in range(...) |
| Predefined process (double-barred box) | calling a function |
Start and End | the top and the bottom of the program |
One more pattern is worth knowing. A counted loop is so common that most languages have a shorter form. These two programs are the same:
i = 1
while i <= 3:
    print(i)
i = i + 1for i in range(1, 4):
print(i)In the second version, range(1, 4) produces 1, 2, 3, stopping before 4. The three loop parts (initialization, condition, update) are packed into one line. Use for when you know how many passes there are, and while when you repeat until something happens, as in the PIN and sentinel examples.
Reading a flowchart you did not draw
You will often be handed someone else's chart, in an exam or on a whiteboard. Read it in a fixed order.
- Find
StartandEndfirst. Make sure every path can get to anEnd. - List the variables the chart uses and give each one a column.
- Find the loops. A loop is any arrow that points to a box above it. For each, identify the initialization, the condition and the update, and check that the update moves towards stopping.
- Walk it with a small input, updating your table.
- Walk it with a second input that takes a different path.
If a chart has a loop and you cannot find the update, assume the chart is wrong and look closely there.
When to use a flowchart, and when not to
Flowcharts shine for a small number of decisions with several outcomes, for explaining a process to someone who does not read code, and for spotting missing cases. They are a poor fit for large algorithms. A sorting routine with many nested loops becomes a tangle of arrows that is harder to follow than the code. That is why the next lesson introduces pseudocode, which keeps the logic but scales better. Use a flowchart as a thinking aid, and when it gets bigger than one page, switch to pseudocode.
Common mistakes
A diamond with only one exit. Every question needs both a Yes path and a No path. If you cannot decide what happens on No, you have found a missing case in your design, which is exactly what flowcharts are for.
A diamond used for an action. A diamond only asks. "Add 1 to total" belongs in a rectangle. "Is total greater than 10?" belongs in a diamond.
Boxes with no arrow out. A box with no outgoing arrow is a dead end, and a reader will not know what happens next. Every box except End has an arrow out.
Crossing arrows with no clear direction. If a drawing looks like spaghetti, redraw it. Flow downwards, and use one clean return arrow per loop.
Forgetting the update. A loop with no update step repeats forever, since nothing makes the condition fail. In code, that is a program that hangs:
Output (the passes guard rescues it here, so you can see the problem):
1
1
1
1
1
The line i = i + 1 is missing, so i is always 1 and i <= 3 is always true. Without the guard, this program would never finish. If you ever run a program that seems frozen, press Ctrl+C in a terminal and look for a loop whose condition cannot become false.
Reading input only once in a sentinel loop. Without the second read x at the bottom, the loop keeps testing the same value. The symptom is the same endless output.
Comparing with the wrong boundary. i < 3 and i <= 3 differ at the last value. Always trace the last pass by hand.
Testing only one arrow. A chart with four exits needs at least four inputs, one for each. Choose them so that every arrow is walked.
A debugging walkthrough
A student draws a chart to print whether a number is a "small", "medium" or "large". Small is below 10, medium is 10 to 99 and large is 100 or more. The code written from the chart is:
n = int(input())
if n > 10:
    print("medium")
elif n > 100:
    print("large")
else:
    print("small")
It seems fine with n = 5 (small) and n = 50 (medium). Test the boundaries, which are 9, 10, 99, 100 and 101.
n | Expected | What happens |
|---|---|---|
| 9 | small | 9 > 10 false, 9 > 100 false, else: small (correct) |
| 10 | medium | 10 > 10 false, 10 > 100 false, else: small (wrong) |
| 99 | medium | 99 > 10 true: medium (correct) |
| 100 | large | 100 > 10 true: medium (wrong) |
| 101 | large | 101 > 10 true: medium (wrong) |
Two separate bugs show up. First, n > 10 should be n >= 10, since 10 is medium. That is an off-by-one in the comparison. Second, the questions are in the wrong order: every number above 100 is also above 10, so the first question swallows them and the large branch is unreachable. This is the same ordering mistake as the grade bands. The fix puts the narrowest question first:
n = int(input())
if n >= 100:
    print("large")
elif n >= 10:
    print("medium")
else:
    print("small")
Recheck the five boundary values: 9 gives small, 10 gives medium, 99 gives medium, 100 gives large, 101 gives large. All correct. The method was to list expected answers first, then walk the chart for each. Doing it in that order stops you from believing your own code.
Where flowcharts are used
Beyond classrooms, flowcharts appear in product work as user flows (what screens a customer sees and which choices lead where), in support teams as troubleshooting guides ("Is the light blinking? Yes: restart. No: check the cable"), in business as approval workflows (a purchase request over a certain amount goes to a manager), and in medicine as triage guides. Software teams also turn flowcharts into state machines and workflow engines, so the picture you draw can become the structure of the real program.
In interviews, drawing a quick flowchart for a problem with many cases (for example, a vending machine that must handle coins, change and a sold-out item) shows that you can organise decisions before writing code. Interviewers like to see you spot a missing case from the drawing.
Practice
- Draw the flowchart for "read a number and print
EvenorOdd". How many exits does the diamond have, and what are they labelled?
Solution
Start, read n, a diamond n % 2 == 0 ?, a Yes exit to print "Even", a No exit to print "Odd", and both flowing into End. The diamond has two exits, labelled Yes and No.
- Trace the loop flowchart from Example 2 with the condition changed to
i <= 0. What is printed?
Solution
Nothing. i starts at 1, and 1 <= 0 is false at the first visit, so the chart goes straight to End. A loop whose condition is false at the start runs zero times.
- Trace Example 5 for
n = 4and write thetotalafter each pass.
Solution
Passes: i = 1 gives total 1, i = 2 gives 3, i = 3 gives 6, i = 4 gives 10. Then i becomes 5, 5 <= 4 fails, and the chart prints 10.
- Draw (in text) a flowchart that reads two numbers and prints the larger. Then write the Python.
Solution
Chart: Start, read a, b, diamond a > b ?, Yes to print a, No to print b, both to End.
a = int(input())
b = int(input())
if a > b:
    print(a)
else:
    print(b)
For a = 7, b = 3 it prints 7. For equal values it prints b, which equals a, so the answer is still right.
- The chart for "is a person eligible to vote" asks
age >= 18 ?and printsYesorNo. Which ages would you test to cover the boundary and both exits?
Solution
17 (just below, takes No), 18 (exactly at the boundary, takes Yes) and 19 or any larger age (takes Yes). Also consider 0. The pair 17 and 18 is the one that catches > written instead of >=.
- Write a program that reads
nand prints the numbers fromndown to 1, one per line. Describe the initialization, the condition and the update.
Solution
n = int(input())
i = n
while i >= 1:
    print(i)
    i = i - 1
Initialization: i = n. Condition: i >= 1. Update: i = i - 1. For input 3 the output is 3, 2, 1, each on its own line. For input 0 nothing is printed.
- Read numbers until the user types -1, then print only the largest number entered (not counting the -1). Assume at least one real number is entered. Which value must
beststart as?
Solution
x = int(input())
best = x
while x != -1:
    if x > best:
        best = x
    x = int(input())
print(best)
best starts as the first number read, not as 0, because every real number could be negative. For the input -5, -2, -1 it prints -2 (the -1 is the stop signal and is never compared). For 4, 9, 7, -1 it prints 9. This version assumes a real value is never -1, since -1 means stop.
- The chart for a password check allows 3 tries, but a student writes the loop condition as
tries <= 3withtriesstarting at 0. How many attempts does the user actually get, and why?
Solution
Four. tries takes the values 0, 1, 2, 3 when the question is asked, and <= 3 is true for all four, so the loop body runs four times. The right condition is tries < 3. This is an off-by-one error caused by starting at 0 and using <=.
- Grade bands: the questions are in the order
marks >= 60,marks >= 70,marks >= 80,marks >= 90. Which grade does a mark of 95 get, and which grade can never be printed except by the first?
Solution
A mark of 95 passes the first question (>= 60), so it gets D. Only the first branch can ever run for any mark of 60 or more, so grades C, B and A are unreachable. The fix is to ask the highest bound first, so each question narrows the range.
- Draw a flowchart and write a program that reads a whole number
ngreater than 1 and printsPrimeif no number from 2 ton - 1divides it, otherwiseNot prime. Include the loop's initialization, condition and update. Then name the early-exit idea.
Solution
n = int(input())
is_prime = True
d = 2
while d < n and is_prime:
    if n % d == 0:
        is_prime = False
    d = d + 1

if is_prime:
    print("Prime")
else:
    print("Not prime")
Initialization: d = 2, is_prime = True. Condition: d < n and is_prime. Update: d = d + 1. The flag is_prime makes the loop stop early as soon as a divisor is found, which is the same two-exit loop as the PIN example. For 7 it prints Prime, for 9 it prints Not prime (3 divides 9), and for 2 the loop never runs, so it prints Prime.
What you now know
- A flowchart draws an algorithm as boxes and arrows. The oval is Start or End, the rectangle is a step, the parallelogram is input or output, the diamond is a yes/no question and the arrow is the direction.
- A decision has exactly two labelled exits. Three or more outcomes need a chain of diamonds, and the order of the chain matters.
- A loop is an arrow back to an earlier box. Every loop has an initialization, a condition and an update.
- Sentinel loops read once before the loop and again at the bottom of every pass.
- Test a flowchart so that every arrow is walked at least once, and test the boundary values.
- Each shape translates directly to Python:
if,elif,else,while,for,inputandprint.