Why this matters
Your code will have bugs. Not sometimes: always, and from your first program to your last. A bug is a mistake in a program that makes it behave differently from what you meant. Debugging is the work of finding the mistake and fixing it.
Studies of working developers keep finding the same thing: a large share of the working week goes to reading code and tracking down why it does not do what was expected. People who are good at it are not smarter. They have a method, and they do not guess. A beginner without a method changes lines at random, hoping, and sometimes makes the program worse. A beginner with a method finds the same bug in minutes.
This lesson teaches the method first, since it works in every language and every tool. Then it shows two toolkits that carry it out: print statements and the debugger built into VS Code. By the end you will have fixed more than half a dozen real bugs by following the same five steps.
Three kinds of bug
Not all bugs behave alike, and knowing which kind you face tells you where to look.
- Syntax errors. The code breaks the grammar of the language, so the program cannot even start. Node stops and prints a
SyntaxErrorbefore running a single line. These are the easiest: the message names the line. Example: a missing bracket. - Runtime errors. The code is valid and starts, then hits something impossible and crashes midway. A
TypeErrororReferenceErroris a runtime error. The program printed some output and then stopped with a message. The message gives the line. - Logic errors. The program runs to the end with no error and prints the wrong answer. These are the hardest, because nothing tells you where to look. The computer did exactly what you asked, and you asked for the wrong thing.
Most of this lesson is about logic errors, because syntax and runtime errors come with a built-in pointer. You already know how to read those messages from the last lesson. Here is a quick one of each, so you can tell them apart. This is a syntax error, found before anything runs:
function isEven(n) { if (n % 2 = 0) { return true; } return false; }
                         ^^^^^

SyntaxError: Invalid left-hand side in assignment
A single equals sign = assigns a value. The test for equality is ===. The caret marks the spot. The program never starts.
The method
Debugging is an experiment, like in a science lesson. You have a belief about what the code does. The program shows you that the belief is wrong somewhere. You find where.
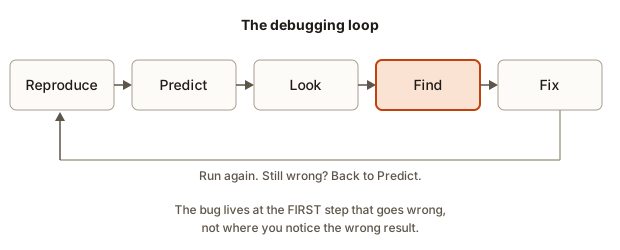 The debugging loop: reproduce, predict, look, find, fix, then run again and go back to predict if it is still wrong
- Reproduce. Make the problem happen every time, with the smallest input that shows it. Write down exactly how: what you typed, what you clicked. If you cannot make it happen on demand, you cannot know when you fixed it.
- Predict. Before you look at anything, work out what the code should do at each step for this input. Use paper if needed. This sets your expectation. Without it you will look at the output and think "that seems plausible" about something wrong.
- Look. See what the program really does at each step. You do this with print statements or the debugger. Look at actual values, not at what you think the values are.
- Find. Locate the first place where the real value differs from your prediction. The bug is there.
- Fix. Change one thing. Run again with the same input from step 1. If it is still wrong, you return to step 2.
The most important sentence in the lesson: the bug is at the first step that goes wrong, not at the place where you notice it. A wrong total printed at the end can come from a mistake made on line 4. If you start at the place where you noticed it, you will stare at correct code.
An analogy: a wrong answer at the end of a long sum on paper. You do not rub out the final line and rewrite it. You re-check each line, from the top, until you find the first line where your number differs from the calculator's.
A second rule: change one thing at a time. If you change three lines and the bug vanishes, you do not know which fix mattered. If it gets worse, you do not know which change broke more. One change, one run.
Worked example 1: the average that is too low
This function should give the average of a list of scores. Save it as avg.js or run it right here:
The output is:
63.333333333333336Follow the five steps.
Reproduce. The bug appears for [80, 90, 100] every time. This is a small input already, which is good.
Predict. The average is (80 + 90 + 100) / 3, which is 90. The sum should reach 270. Each step of the loop should add one score, so the running sum should read 80, 170, 270.
Look. Add a console.log inside the loop to see each step. The next block does that:
i = 1 value = 90 sum before = 0
i = 2 value = 100 sum before = 90
63.333333333333336
Find. Compare with the prediction. I predicted three steps, with values 80, 90, 100. The program ran only two, and the first value it saw was 90. The very first step goes wrong, because i starts at 1, so numbers[0], the 80, is never added. The sum ends at 190, and 190 divided by 3 is 63.33.
Why did the loop start at 1? Counting in JavaScript, and in nearly every language, starts at 0. The first item of a list sits at index 0, the second at index 1. A loop that starts at 1 skips the first item. This is an off-by-one error, one of the most common bugs in programming.
Fix. Change let i = 1 to let i = 0. Run with the same input: the output is 90.
Then remove the debug prints. They have done their job.
Print statements: the first tool
Printing values is the oldest debugging tool and still used by experts. It needs no setup and works in every language. A few habits make it much better.
Label what you print. console.log(x) prints a bare number and you cannot tell which line it came from. Print a label with it:
console.log("sum after adding", numbers[i], "=", sum);Print before and after. To find where a value changes, print it on both sides of a suspect line.
Print whole structures. For lists and objects, console.log shows the contents. For a list of records, console.table draws a grid, which is far easier to read. Run this block:
┌─────────┬────────┬───────┬─────┐
│ (index) │ item   │ price │ qty │
├─────────┼────────┼───────┼─────┤
│ 0       │ 'pen'  │ 10    │ 3   │
│ 1       │ 'book' │ 120   │ 1   │
│ 2       │ 'bag'  │ 450   │ 2   │
└─────────┴────────┴───────┴─────┘
total: 1050
Python has a shortcut. An f-string with an equals sign prints the name and the value together:
n=4 total=4
n=9 total=13
n=2 total=15
You get n=4 total=4 without typing the names twice.
Print the type when in doubt. console.log(typeof x) shows whether a value is a number, text or something else. The next example needs that.
Remove what you added. Debug prints left in code clutter the output and confuse the next person. Delete them when the bug is fixed. A search for console.log in the project (Ctrl+Shift+F) finds the leftovers.
The weakness of printing: each question means editing the code and running again. When the program is slow to start or the bug hides deep, that gets tiring. That is where the debugger wins, and you get to it below.
Worked example 2: the largest number that is wrong for negatives
A function should return the largest number in a list:
9
0
The first call is right. The second should print -2, and it prints 0.
Predict. For [-5, -2, -8], best should start somewhere, then be replaced by -5, then by -2, and stay -2.
Look and find. Tracing the code on paper: best starts at 0. The first number, -5, is not larger than 0, so best stays 0. -2 is not larger than 0 either. Nothing ever beats the starting value, so the function returns the starting value, and 0 is not even in the list. The mistake is on line 2, the first line of the function, even though the wrong answer only shows at the end.
Fix. Start from the first item of the list instead of from a made-up number: let best = numbers[0];. This is a general lesson: a starting value must never be a guess that real data can lose to. With the fix, the second call prints -2.
This bug did not appear in the first test. A good test list includes the odd cases: negatives, one item, an empty list, duplicates. You will practise this thinking again in the data structures module.
Worked example 3: the sum that joins
A program reads two numbers and should print their sum. In the Input box, type 5, press Enter, then type 3:
a + b = 53
typeof a: string
fixed: 8
The program printed 53 instead of 8. Predict: 5 + 3 should be 8. Look at the types: typeof a says string, which means text. Input always arrives as text, even when it looks like a number. And + between two pieces of text joins them: "5" + "3" is "53". The fix is to convert with Number(...) first.
The tool here was printing a type, not a value. When two values look right but behave oddly, check their types.
Worked example 4: three equal numbers
A program creates three timers that should print 0, 1 and 2. The first loop uses the older var and the second let. Run it:
var 3
var 3
var 3
let 0
let 1
let 2
The first loop prints 3 three times. The cause is scope: where a variable is visible. var makes one single i for the whole loop, and by the time the timers run (after the loop finished) that one i is 3. let makes a fresh j for each turn of the loop, so each timer remembers its own value. This is why modern JavaScript uses let and const, and avoids var. Debugging lesson: when a value is "stuck", suspect that several pieces of code share one variable.
Worked example 5: bisecting a pipeline
Many programs are a chain of steps, each handing its result to the next. When the final answer is wrong and the chain is long, you do not read every line. You use the same idea as a number-guessing game: check the middle, and see which half holds the bug. This is called bisecting.
This program should turn the messy text into clean names, such as Anisha Rao:
1 split: [ '  Anisha Rao ', ' ravi kumar', 'MEERA  ' ]
2 trim: [ 'Anisha Rao', 'ravi kumar', 'MEERA' ]
3 lower: [ 'anisha rao', 'ravi kumar', 'meera' ]
4 title: [ 'Anisha rao', 'Ravi kumar', 'Meera' ]
The last line is wrong: it shows Anisha rao, and we wanted Anisha Rao. Rather than staring at the last line, check the stages in order. Steps 1, 2 and 3 produce exactly what you would predict: the pieces are split, trimmed and lower-cased. The first stage that differs from prediction is step 4. Its code capitalises only p[0], the first character of the whole string, so the second word stays lower case.
A fix is to capitalise each word. Split the string on spaces, capitalise each word, and join:
const titled = lowered.map(p =>
  p.split(" ").map(w => w[0].toUpperCase() + w.slice(1)).join(" ")
);
Printing every stage is a cheap form of bisecting. With a thousand-line program you would print the middle first, see whether the value is already wrong there, and halve the range each time.
Worked example 6: reading a crash
Here the program does not give a wrong answer. It dies. This file:
const user = { name: "Anisha" };
console.log(user.address.city);
prints:
console.log(user.address.city);
                         ^

TypeError: Cannot read properties of undefined (reading 'city')
    at Object.<anonymous> (.../user.js:2:26)
Reproduce: it happens on every run. Predict: I expected a city name. Look: the message says something is undefined, and the caret points at .city. So the thing before .city, which is user.address, is undefined: the object has no address. Find: the object on line 1 has only name. The fix depends on what you want. If every user must have an address, the data is wrong and you fix the data. If an address is optional, the code must cope. JavaScript has a safe-access operator for that, ?., and a fallback operator, ??. Run this block:
undefined
unknown
user.address?.city stops and gives undefined instead of crashing, and ?? "unknown" supplies a default when the left side is undefined. Many real-world crashes come from this one shape: data that was expected and is missing.
The debugger
A debugger is a tool that lets you pause a program while it runs and look inside. You choose where it pauses, then you step forward one line at a time and watch the values change. Printing asks questions by editing code. A debugger asks them without touching the code.
What happens inside
When you start debugging a Node program, VS Code does not run node hello.js the plain way. It starts Node with its inspector switched on (the same effect as node --inspect). The inspector opens a local connection that lets another program send commands to Node and receive information. VS Code connects to it. When you set a breakpoint, VS Code tells Node "stop when you reach line 5 of this file". Node runs normally until it reaches that line. Then it freezes and reports its state: the values of all variables and the chain of function calls. VS Code shows that in its panels. When you click Step, VS Code tells Node to run one more line and report again.
Nothing is guessed. You see the real values at that real moment, and the program is paused until you let it go.
Set a breakpoint
A breakpoint is a mark on a line that says "pause here". To set one, click in the gutter, the narrow strip left of the line numbers, next to the line sum = sum + numbers[i];. A red dot appears. Click it again to remove it. F9 toggles a breakpoint on the current line.
Start the debugger
- Open
avg.js(the buggy version, withlet i = 1). - Open the Run and Debug view with
Ctrl+Shift+D. - Click Run and Debug. If VS Code asks for an environment, pick Node.js. (You can also press
F5.) - The program starts and stops at the breakpoint. The line is highlighted in yellow and an arrow shows it has not run yet.
The paused line has not executed yet. It is the line about to run.
The Variables panel
On the left you see Variables, split into groups. Local holds the variables of the current function: here i, sum and numbers, with their current values. On the first pause, i is 1. That is the clue: a correct loop would have started with i equal to 0. You found the first wrong thing without adding a single print line.
Expand numbers and you can see its three items. Hover over a variable name in the code and a small box shows its value.
Stepping
At the top of the screen is a small toolbar. These controls move the program forward:
| Control | Key | What it does |
|---|---|---|
| Continue | F5 | Run until the next breakpoint, or to the end |
| Step Over | F10 | Run this line completely, then stop on the next one |
| Step Into | F11 | If this line calls a function, go inside it |
| Step Out | Shift+F11 | Finish the current function and stop where it was called |
| Restart | Ctrl+Shift+F5 | Stop and start again |
| Stop | Shift+F5 | End the debug session |
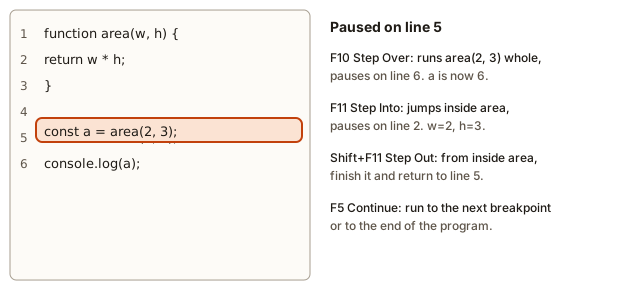 A paused program with step over, step into, step out and continue shown against the same line of code
The difference between over and into is the one beginners ask about most. Look at the picture. The line const a = area(2, 3); calls a function. Step Over treats the call as one step: it runs area(2, 3) entirely and stops on the next line. Step Into goes inside area and stops on its first line, so you can watch the function's own variables. Step Out runs the rest of the current function and returns you to the caller.
A rule of thumb: step over lines you trust, and step into lines you suspect. If you step into a function you did not mean to enter, press Shift+F11 to come out.
Trace of the debugger on the bug
With the breakpoint on sum = sum + numbers[i]; in the buggy program, this is what you see, press by press. Values are the ones on the line about to run.
| Press | Paused with | i | sum | Next line adds |
|---|---|---|---|---|
| Run | first pause | 1 | 0 | numbers[1], which is 90 |
F5 | second pause | 2 | 90 | numbers[2], which is 100 |
F5 | program ends | output 63.33... |
At the first pause, sum is 0 and i is 1. The first number added will be numbers[1], which is 90. If you predicted that the first number added would be 80, the difference appears right here. The debugger makes the first wrong step visible. After fixing i, you get three pauses with i equal to 0, 1 and 2, and sum equal to 0, 80, 170.
The Watch box and the Debug Console
The Watch section lets you type any expression and see its value at every pause. Click the plus sign and type sum / 2 or numbers.length - i. The value updates each time the program pauses. It is useful for something you would otherwise have to print repeatedly.
The Debug Console, in the bottom panel, lets you type an expression while paused and press Enter to see its result. Try numbers[0]. You are asking the running program a question. You can even call a function there. Be careful: if you assign to a variable, you change the running program.
The Call Stack
The Call Stack panel lists the functions currently active, with the one you are inside on top. When average is called from the top level of avg.js, the panel shows average, then below it (anonymous), the main body of the file. Click an entry to see the variables in that function's frame. This is the same list as the at lines in an error's stack trace, but live. When a function is called from several places and misbehaves, the call stack tells you who called it this time.
Breakpoints that think
Right-click the red dot, choose Edit Breakpoint, and you can add a condition. A conditional breakpoint pauses only when an expression is true, such as i === 99. It saves you from pressing F5 ninety-nine times to reach the interesting turn of a loop.
A logpoint is a breakpoint that does not pause. It prints a message, written like i is {i}, and carries on. It acts as a print statement that you add and remove without editing the code, so you cannot forget a stray one in the file.
The Breakpoints panel lists all of yours, lets you switch them off one by one, and has a checkbox for pausing on errors, called Uncaught Exceptions. With that on, the debugger stops right where a crash happens, with all values visible.
Debugging a program that reads input
Programs that read stdin have a snag: the debugger's own console does not feed them keyboard input. The solution is to run the debug session in the terminal. Create .vscode/launch.json:
{
  "version": "0.2.0",
  "configurations": [
    {
      "type": "node",
      "request": "launch",
      "name": "Run current file",
      "program": "${file}",
      "console": "integratedTerminal"
    }
  ]
}
"program": "${file}" debugs whichever file is open. "console": "integratedTerminal" runs the program in the real terminal panel, where you can type input, and finish with Ctrl+D (Ctrl+Z then Enter on Windows). The assignment at the end of this module uses this.
Python
With the Python extension installed, the debugger works the same way: set a red dot, press F5, and choose Python File. The controls and panels are identical. This is a main benefit: learn the panels once and use them for every language.
Worked example 7: the loop that never ends
A countdown prints 3, 2, 1 and then "liftoff":
3
2
1
liftoff
Suppose you wrote n++ instead of n--. Then n grows forever, n > 0 is always true, and the program prints 3, 4, 5 and never stops. This is an infinite loop. In the terminal, press Ctrl+C. In the debugger, press the Pause button, which stops it at whatever line it happens to be on, and look at n in the Variables panel. You see a large number, and the question "why is this still going?" answers itself: the loop test never turns false, and n moves the wrong way.
Another version is an off-by-one at the other end. Look at this loop over a list of three items, where the condition uses <=:
const items = ["a", "b", "c"];
for (let i = 0; i <= items.length; i++) {
  console.log(i, items[i]);
}0 a
1 b
2 c
3 undefinedThe list has indexes 0, 1, 2. The loop also visits 3, which is past the end, and items[3] is undefined. Use < when the end is the length. Printing undefined where you did not expect it is a hint that you ran past the end of a list.
Smaller tools worth knowing
The rubber duck. Explain your code, line by line, out loud, to a rubber duck, a friend or an empty chair. When you say "and then this adds each score", you may hear that it does not add the first one. The act of saying it slowly makes you check what you believe. It sounds silly and it works so reliably that experienced developers do it.
Minimal reproduction. Shrink the problem. Copy the failing part into a new small file and cut everything not needed. Often the bug disappears halfway through cutting, and the last thing you removed is the culprit. If it does not disappear, you now have a tiny example that is easy to reason about, and easy to show someone else.
Read the error message properly. Read it slowly from the top. Look for the kind, the message and the first line of your own code in the trace. Then search for the message text, leaving out your own file paths. Someone has met this error before.
Use Git. If the program worked an hour ago and now fails, git diff shows what changed since the last commit, and the bug is almost certainly in that change. Small, frequent commits make this a powerful habit. A longer-term tool, git bisect, finds the exact commit that introduced a bug by halving the history, and applies the same bisecting idea you used above.
Take a break. After an hour on one bug, your assumptions are fixed. A walk, a glass of water, or a night's sleep often reveals the answer in the first minute back.
Ask well. When you must ask for help, give four things: what you expected, what happened instead, the exact error text, and the smallest code that shows it. A question with those four parts is often answered in minutes, and often answers itself as you write it.
Common mistakes
Changing many things at once. After three edits you cannot say which one mattered. One change per run.
Fixing the symptom. You see NaN printed and add a line to replace NaN with 0. The real bug, which sent a bad value into the calculation, is still there and will hurt you elsewhere. Ask why the value is wrong, not how to hide it.
Assuming instead of looking. "That variable must be 5 here." Print it or watch it. Most debugging is the discovery that something you were sure about was false.
Trusting the first suspect. You suspect line 12 and spend an hour on it. Use bisecting to check which half of the program is clean before you commit to a theory.
Debugging the wrong version. You edit the file and forget to save, or you debug a file other than the one you changed. Check the tab for a dot and the file name in the debug toolbar. A sentinel console.log("v2") proves which file ran.
A breakpoint that never hits. The red dot is hollow or grey, or the program runs past it. Common causes: the line cannot run (a comment, a blank line, or code that is never reached), the file you are debugging is not the one with the breakpoint, or the program finished before reaching it. Place the breakpoint on a line with real code on the path your input takes.
Stepping into library code. You press F11 on a built-in call and land in unfamiliar internals. Press Shift+F11 to step out, and use F10 on lines you do not need to enter.
Leaving breakpoints and prints behind. A forgotten console.log ships to users. Search the project for console.log before you commit, and use logpoints for temporary output.
Fixing without a test. After the fix, run the original failing input and also a nearby one, such as the negative case from example 2. A fix that handles only the one input you tried may break the next.
Blaming the computer. The computer, the language and Node are almost never wrong. It nearly always does exactly what the code says. When a result is unexpected, the code says something different from what you intended, and finding that difference is the entire job.
A full debugging walkthrough
Here is a complete session on a new bug. A shop function computes the price after a percentage discount:
total: 230
average discount price: 115
The shop owner complains: "The average price after discount should be 115." You are checking. So far the program is right: 200 with 10 percent off is 180, and 100 with 50 percent off is 50. Together that is 230, and the average is 115. The numbers match.
Now the owner says: "But for a product at 200 with 10 percent, our receipt says 190." Now you have a report with a concrete input. Use the method.
Reproduce. Call applyDiscount(200, 10) alone and print it. It prints 180, not 190. So the function is correct for that input. The bug is not in the function. Where is the receipt number from? You search the project (Ctrl+Shift+F) for the word discount and find that the receipt code calls a different function, applyFlatDiscount, which subtracts 10 as a plain amount, not as a percent.
Predict and find. For input 200 and 10, the receipt code should call the percent function and get 180. It calls the flat one and gets 190. The first place reality and prediction differ is the call, not the maths.
Fix. Change the receipt code to call applyDiscount. Run the same input. It prints 180. Then run the second case, 100 and 50, which prints 50.
Notice what the method saved: you did not rewrite applyDiscount, which was correct. You proved which part was healthy by testing it alone, and moved your attention to the real suspect. Narrowing down which code is innocent is as valuable as finding the guilty line.
Interview and real-world use
Debugging is an interview topic more often than people expect. A common exercise gives you a small program with a planted bug and asks you to find it while thinking aloud. The interviewer watches your method, not your speed. Strong candidates state the expected behaviour, reproduce, check an intermediate value, and narrow down. They do not change code before they understand it.
At work, the same skills appear as reading logs, which are printed records a program writes as it runs, and as reproducing a customer's report. A bug report that arrives as "it does not work" becomes a precise question once you have a method: what did you do, what did you expect, what happened. Teams also write a test for each bug after fixing it, so the bug cannot return unnoticed. That idea grows into a full module later.
Practice
- This function should add the numbers from 1 to
n, butsumTo(5)prints 10 instead of 15. Find the bug with aconsole.loginside the loop and fix it. The code usesfor (let i = 1; i < n; i++). - Write the five debugging steps in your own words, using the
sumTobug as the example for each step. - Set a breakpoint in
avg.js, start the debugger, and step through the loop withF10. Write downiandsumat each pause. Then fix the loop and repeat. - This code prints
[ 1, 10, 9 ]for[10, 9, 1].sort(). Explain why the order is surprising, then fix it so the output is[ 1, 9, 10 ]. "a b".split(" ")(two spaces between the letters) gives a list of three items, not two. Print it to prove it, explain why, and write a version that gives two items.- Use a conditional breakpoint to pause a loop that counts from 0 to 99 only when
iis 50. Write the condition you typed. - A program prints
0.30000000000000004for0.1 + 0.2. Is that a bug in JavaScript? Explain in two sentences and suggest how to print0.3. - Make a file where
user.profile.namecrashes becauseprofileis missing. Fix it two ways: with?.and a default, and by building the object correctly. - A function reads a name from stdin and greets
Hello, NAME, but it printsHello, undefinedwhen the input is empty. Write the function, reproduce the bug with an empty Input box, find the cause with the debugger or a print, and fix it so it printsHello, stranger. - A teammate says "the app prints the wrong total." You cannot see their screen. Write the four-part question you would send back to get what you need, and name two tools from this lesson you would use once you have a reproducible case.
Solution
-
Printing
iinside the loop shows 1, 2, 3, 4, and never 5. The loop conditioni < nstops beforen. Change it toi <= n. ThensumTo(5)is 1 + 2 + 3 + 4 + 5 = 15. This is an off-by-one error at the end of the range. -
Reproduce:
sumTo(5)gives 10 every time. Predict: the running total should be 1, 3, 6, 10, 15. Look: printiandtotalin the loop. Find: the loop never reaches 5, so the last addition is missing. Fix: use<=, then runsumTo(5)again and confirm 15. -
In the buggy version the pauses show
i= 1,sum= 0; theni= 2,sum= 90; then the program ends. After the fix, you seei= 0,sum= 0;i= 1,sum= 80;i= 2,sum= 170. The final sum is 270 and the average is 90. -
sort()with no argument compares items as text, so"10"comes before"9"because"1"is smaller than"9". Fix:[10, 9, 1].sort((a, b) => a - b), which compares as numbers and prints[ 1, 9, 10 ]. -
console.log("a b".split(" "))prints[ 'a', '', 'b' ]. Splitting on a single space cuts at each space, and two spaces in a row leave an empty piece between them."a b".split(/\s+/)treats one or more spaces as one separator and gives[ 'a', 'b' ]. -
Right-click the red dot, choose Edit Breakpoint, pick Expression, and type
i === 50. The program runs normally and pauses only wheniis 50. -
It is not a bug in JavaScript. Computers store most decimal fractions as binary approximations, and 0.1 and 0.2 cannot be stored exactly, so the sum is a hair off. To print 0.3 use
(0.1 + 0.2).toFixed(1), which gives the text"0.3".
const user = { name: "Anisha" };
console.log(user.profile?.name ?? "no profile");
const fixed = { name: "Anisha", profile: { name: "Ani" } };
console.log(fixed.profile.name);
The first uses ?. and ??, and the second builds the object correctly.
- For example:
const input = require("fs").readFileSync(0, "utf8").trim();
const name = input || "stranger";
console.log("Hello, " + name);
An empty string is falsy, so || picks "stranger". A bare lines[0] on empty input would give undefined, which is the original bug.
- Ask: what did you do (the exact steps), what did you expect, what did you get (the exact number or message), and what is the smallest input that shows it. Once you can reproduce it, use print statements or the debugger to look at the values, and bisect the steps of the calculation to find the first wrong one.
What you now know
- Bugs come in three kinds: syntax errors, runtime errors and logic errors, and the first two come with a pointer.
- The method is reproduce, predict, look, find, fix, and the bug lives at the first step that goes wrong.
- Print statements work everywhere: label values, print types, print structures, and bisect a long chain by printing the middle.
- The VS Code debugger pauses a running program at a breakpoint and shows variables, watches and the call stack.
- Step Over runs a line, Step Into enters a call, Step Out leaves it, and Continue runs to the next breakpoint.
- Conditional breakpoints and logpoints save you from editing code or pressing a key a hundred times.
- Change one thing per run, read errors from the top, and shrink the problem until it is small enough to see.